
Environmental Suitability
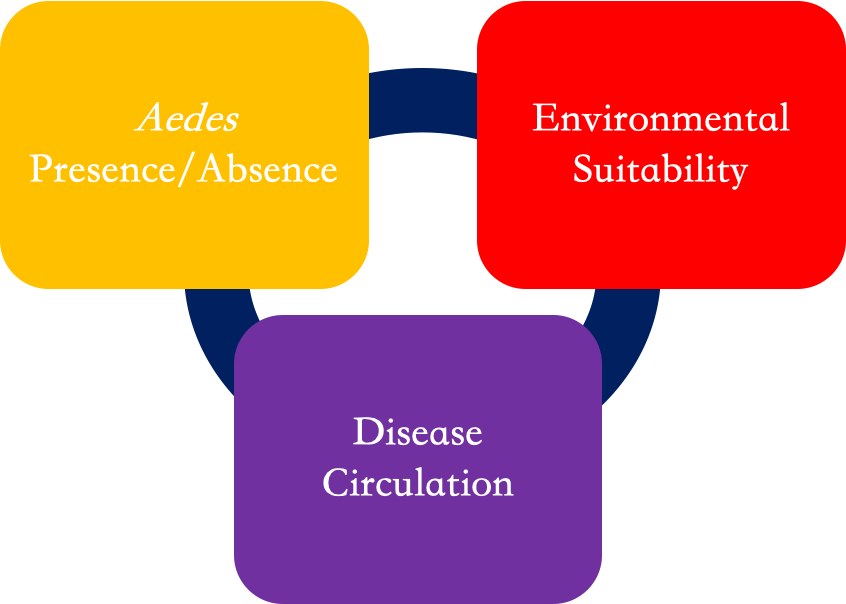
The transmission rate of a disease such as Zika, dengue, or chikungunya, depends on multiple, complex factors. One way of thinking about this process is that transmission depends on the presence of the “vector” (mosquitoes), the presence of the pathogen (virus), and if the environmental conditions are suitable.
Our models focus on monitoring and forecasting environmental suitability, or how capable the environment is to hold the virus and vectors. The vectors considered in this work are the Aedes aegypti and Aedes albopictus mosquitoes, the two main carriers of Zika, dengue, or chikungunya in the Americas.
There are multiple ways to assess environmental suitability; here we use the basic reproductive number, R0. This quantity does not involve direct information on the actual number (presence/absence) of mosquitos in a place, or the present circulation of the disease of interest there, but does use ento-epidemiological information about the vector(s) and the disease. Some of the variables involved depend on climate information, like temperature, humidity, and rainfall.
For example, the Ross-MacDonald model, developed in 1957 to better understand the epidemiology and control of malaria, incorporates temperature-dependent parameters such as vectorial density, mosquito feeding frequency, intrinsic incubation rate, and daily survival rate.
Environmental suitability is just one of the three key components to understanding the transmission rate of a disease. Providing environmental suitability information to decision makers allows them to combine environmental factors with their on-the-ground analysis of mosquito/virus presence to better assess the potential risk of outbreak in their community.
What is R0?
The basic reproductive number, R0, is typically defined as the number of expected additional infected people (cases) that one infected person can generate, on average, over the course of its infectious period, assuming a completely susceptible (naïve) population. Although R0 is often used as a measure of risk of transmission, that risk really depends on multiple complex and difficult to assess factors that are not being directly considered in the R0 models. Hence, here R0 is understood as a measure of environmental suitability for vector-borne diseases and is not used as a direct measure of transmission.
What is an R0 multi-model calibrated system?
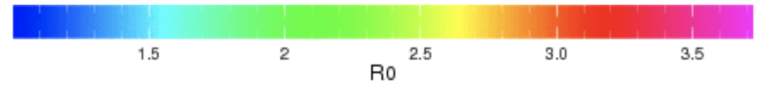
Our particular R0 model is a combination (a calibrated “multi-R0 ensemble”, see above) of four different models preexisting in the literature: the Caminade et al. (2017), the Liu-Helmersson et al. (2014), the Mordecai et al. (2017), and the Wesolowski et al. (2015). See references below. These models have been already calibrated and evaluated by the authors (for an overview and comparison, see Mordecai et al, 2017), and depend on environmental factors, such as surface temperature, to identify the capacity of a particular location to maintain the Aedes mosquitoes and dengue, chikungunya, or Zika. Each model is composed of its own set of equations describing the related mosquito, virus, and human interactions, and each model has its own way to describe the dependence of certain parameters on climate information.
By combining these four models, the AeDES multi-model calibrated system provides R0 values for current and historical conditions, by forcing the system with observed and forecast climate data. For more information on the methodology, please see here (Muñoz et al. 2020). To access the maproom used to monitor R0, please click here. Additionally, advancements are being made to extend this R0 multi-model calibrated system approach to sub-seasonal timescales. For related work, see here (DiSera et al. 2020).
Our team recognizes the importance of considering both climate and socio-economic factors when trying to model the complex system related to Aedes-borne disease transmission. We have also considered eco-evolutionary feedbacks (Tozan et al, 2020).
Why do we use R0 and not number of cases?
R0 depends more directly on environmental variables than the number of infectious cases (or the disease's incidence), making R0 forecasts, in general, more skillful than the number of infected individuals. For example, the number of cases are often underreported or misreported, which may occur if an infected individual is misdiagnosed, with doctors confusing symptoms of dengue with Zika, or if the patient is only given a partial diagnosis, though carrying both Zika and dengue simultaneously.
Due to the usually strong climate signal in R0 for Aedes-borne diseases, it is possible to provide context to a potential outbreak in a specific area, which can be used as actionable information by decision makers.
What is the difference between R0 and Ri (also known as R effective or R1)?
R0 (as described above) assumes that the entire population is susceptible to the disease. Additionally, the value of R0 does not change in real time as the disease spreads, but is solely based on the initial case. Ri, on the other hand, follows how the disease spreads over multiple generations, as it becomes more or less easy to transmit between individuals, by considering immunity in the population, the use of a vaccine, and the number of individuals who have died. It is important to note that all R values are dimensionless numbers and not rates of transmission.
Generations of an Epidemic
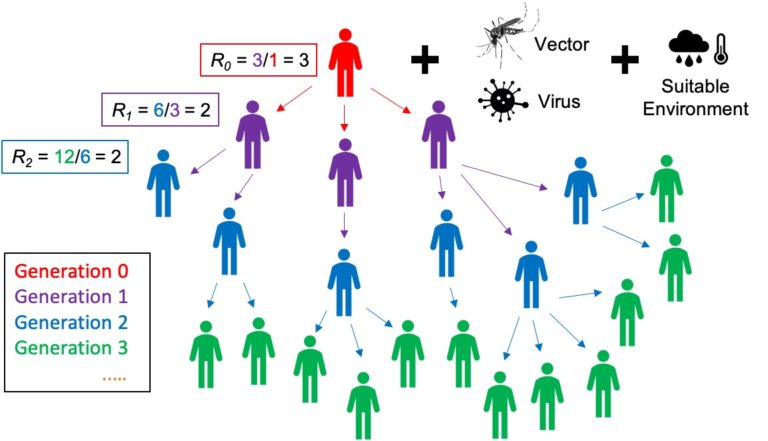
To better understand the generations of an epidemic, let's consider the following example (see Generations of an Epidemic, above). If a traveler (the index case or generation zero) returns to their country infected with a disease, such as Zika or dengue, and their region of residence has an R0 value greater than 1, it is possible for the individual to transmit the disease to others. The value of R0 determines how many people could be infected by the disease via transmission, if the virus and mosquitoes are already circulating in the location, and the human population is susceptible and exposed to them. In the case observed above, the R0 value of 3 suggests that one traveler could transmit the disease to three individuals.
After this first round of transmission occurs, the secondary infections are tracked in real time using R1 (or R effective). The value of R1 is calculated by dividing the number of newly infected individuals (generation 2) by the number of originally infected individuals (generation 1), thus R1 = 6/3 = 2. Subsequently, the second generation has R2 = 12/6 = 2. This compounding effect continues in the population, leading to an outbreak, and runs its course through the ith generation, as the disease will continue to spread until the value of Ri is less than 1. For further information on R0 or Ri, please see Jones (2007) and the other references below.